For the first 6 months 2026 vs. 2025, the number of sales of Single-family Homes is up; Condos and Land sales are down; Multi-family housing and Commercial sales are about the same (practically nil).
Single-Family Home sales continued the uptrend that started in 2025 (after declines in 2023 and 2024). Condo sales have been in a downtrend since 2022. Land sales continue to fall as high building costs are making home building less attractive. Multi-family sales are the same as last year at just one sale, as investors for this type of property are impacted by higher interest rates. Commercial investments are likewise negatively affected by current interest rates; so far this year there have been just two sales, a gain of one over last year.
Uncertainty about the Iran war and its impact on inflation remains a major negative for the Taos real estate market. In Taos, most home purchases are for second or retirement homes by people who live elsewhere; few people move to Taos for work, and not many homeowners in Taos want to change to a different home. Despite a resilient economy, Americans seem to be uneasy. Therefore, many prospective buyers are waiting to see how things develop. This is in sharp contrast to the buyer psychology of 2020-2022, when people were eager to buy real estate despite negative news.
Affordability/value is another factor affecting sales. Home prices have risen so much since 2020 that some buyers are reluctant to pay what it takes to get a nice home here. A 3-bedroom/2-bath home in a good location that cost $350,000- $400,000 before the market exploded in 2020-2022 now costs $550,000 or more.
HOWEVER — The long-term trend for Taos remains positive. This community will continue to draw people for whom the wonderful climate, amazing natural beauty, abundant recreational opportunities, vibrant cultural scene and laid-back lifestyle make it an attractive place to live—at least for those who can afford it.
Click each title below to view the discussion and data for that property type.
The number of sales is up, but prices are down slightly.
Through the first 6 months, unit sales were 139 this year vs. 116 last year, an increase of 23 sales (+19.8%). Dollar sales were up 18.0%, just slightly below the percentage gain in unit sales, as median price declined 2.2%, and average price was off 1.5%.
The market boomed during the Covid pandemic buying frenzy that started in 2020 and peaked in 2022. Sales then fell for two years, bottoming out in 2024. In 2025, the market turned up and the uptrend has continued in 2026 although it’s far from the red-hot market of 2020-2022. The are fewer people actively looking to buy, while the inventory of homes available for purchase. has increased significantly. As a result, the severe imbalance between supply and demand that existed during the boom has moderated. Buyers have more homes to choose from—and more room to negotiate price and terms. If they don’t find a house they really like and at a price they think is reasonable, they don’t buy. During the boom almost everything in reasonably good condition and location was selling at full asking price–or higher. There were often multiple offers. Now, buyers are more selective about a home’s features, location and condition—and more value-conscious. Multiple offers and bidding competitions are uncommon, while discounts from asking price are the norm.
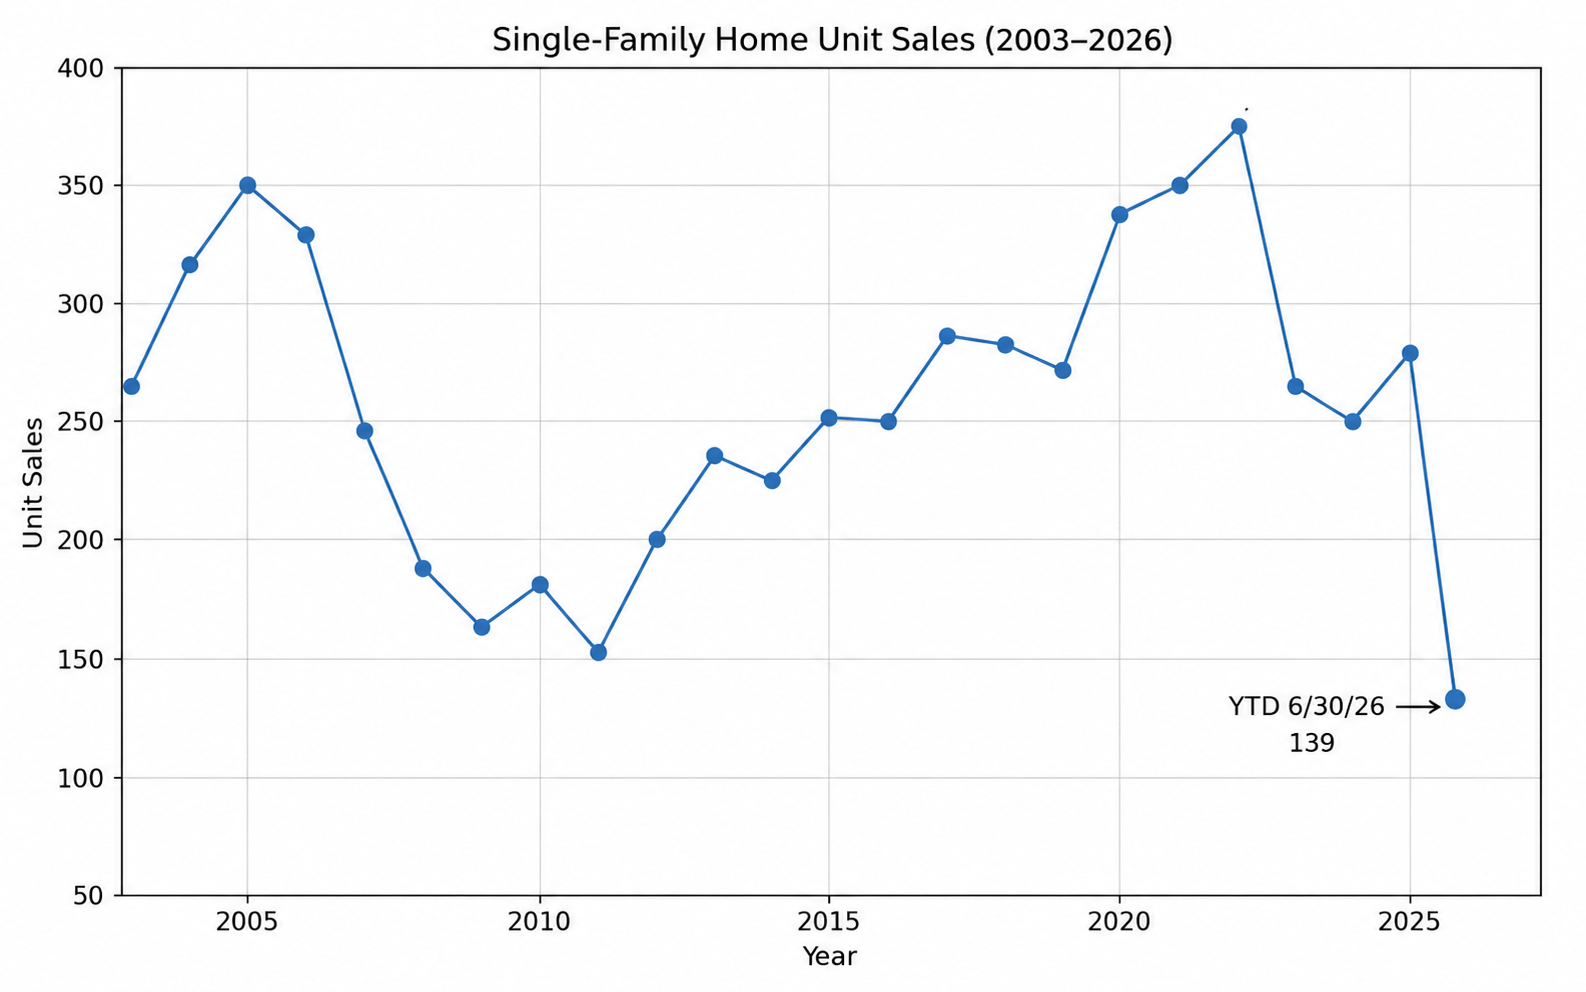
It seems likely that the current pace of sales will remain on track, so that year-end 2026 unit sales will exceed 2025.
MEDIAN AND AVERAGE PRICES
Prices are registering slight declines, although we cannot say that prices are falling significantly across the board.
Median price (midpoint in the range of sales prices from lowest to highest) for the first half of the year was $538,000, a decrease of $12,000 (-2.2%) from $550,000 in 2025 for the same time period.
The average (mean) price was $585,700 vs. $594,800, a decline of $9,100 (-1.5%).
Here is how median and average prices have changed since 2003:
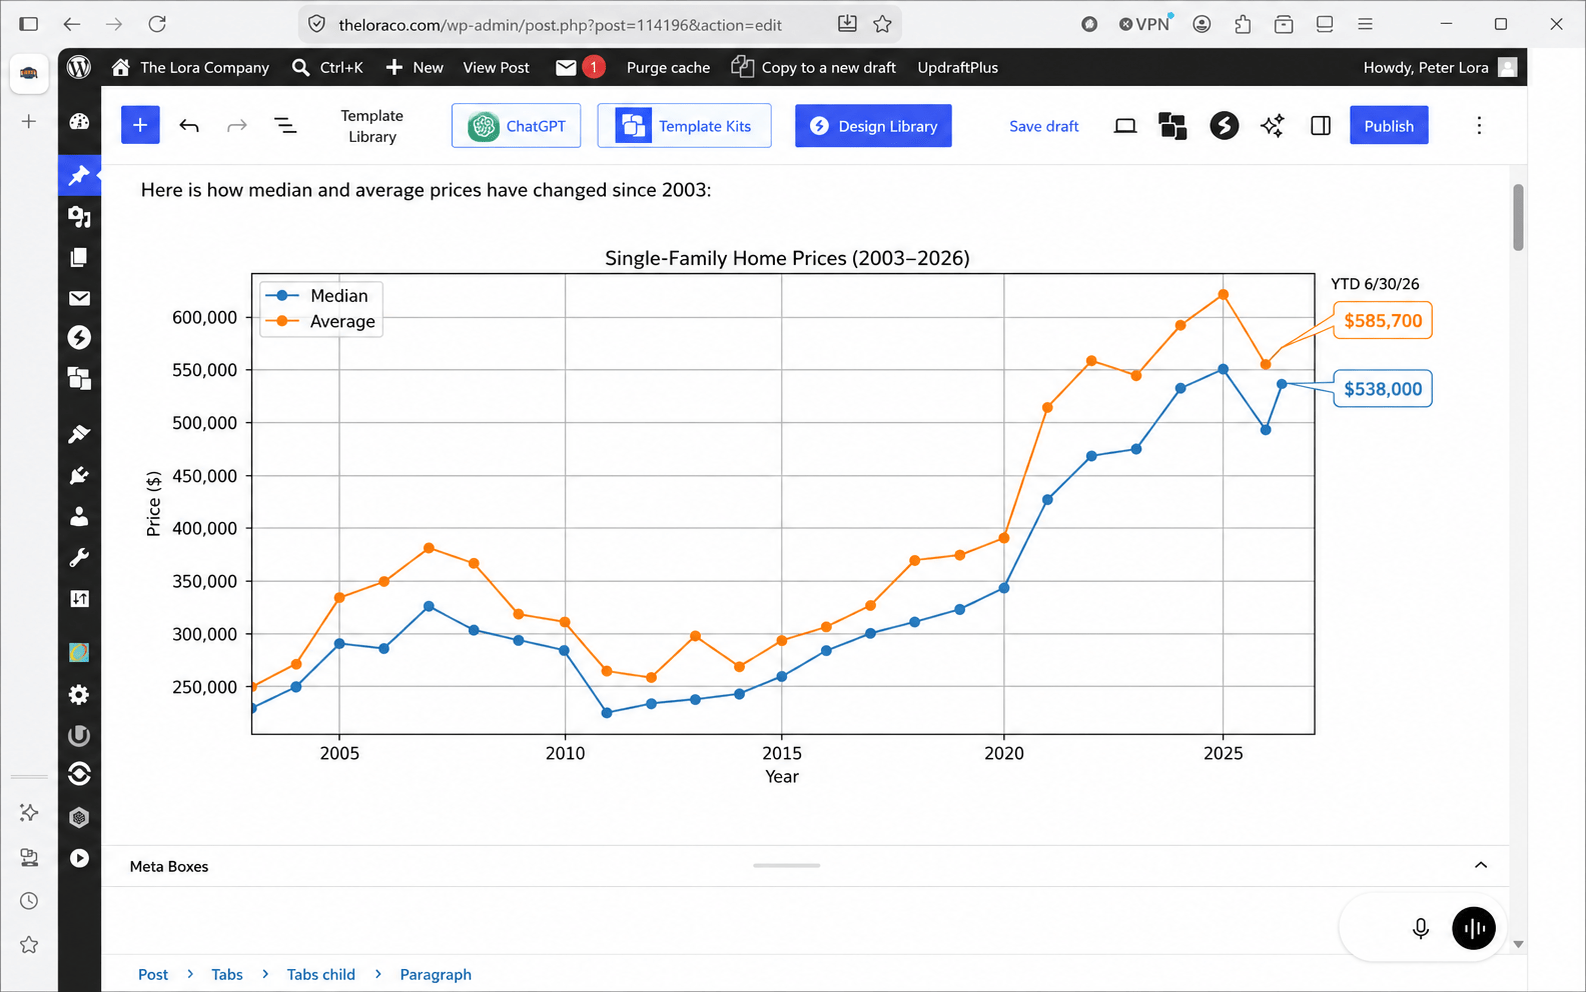
Prices surged during the 2020 – 2022 boom. During those two years, the median price jumped 37%, almost 20% per year. Looking at a broader time frame, from 2020 to 2025, the median increased 60% and average price gained 56%. Looking even further back, from 2016 to 2025, the median has almost doubled! At this point midway through 2026, it appears that prices have flattened. Although the averages are down slightly, it doesn’t seem that prices are actually falling but they may be starting to, as buyer demand remains weak while supply increases. As we have said many times in these reports, due to the very wide mix of housing in Taos, averages are not as accurate a gauge as in markets where the housing stock is not as varied.
PRICE DISCOUNTING
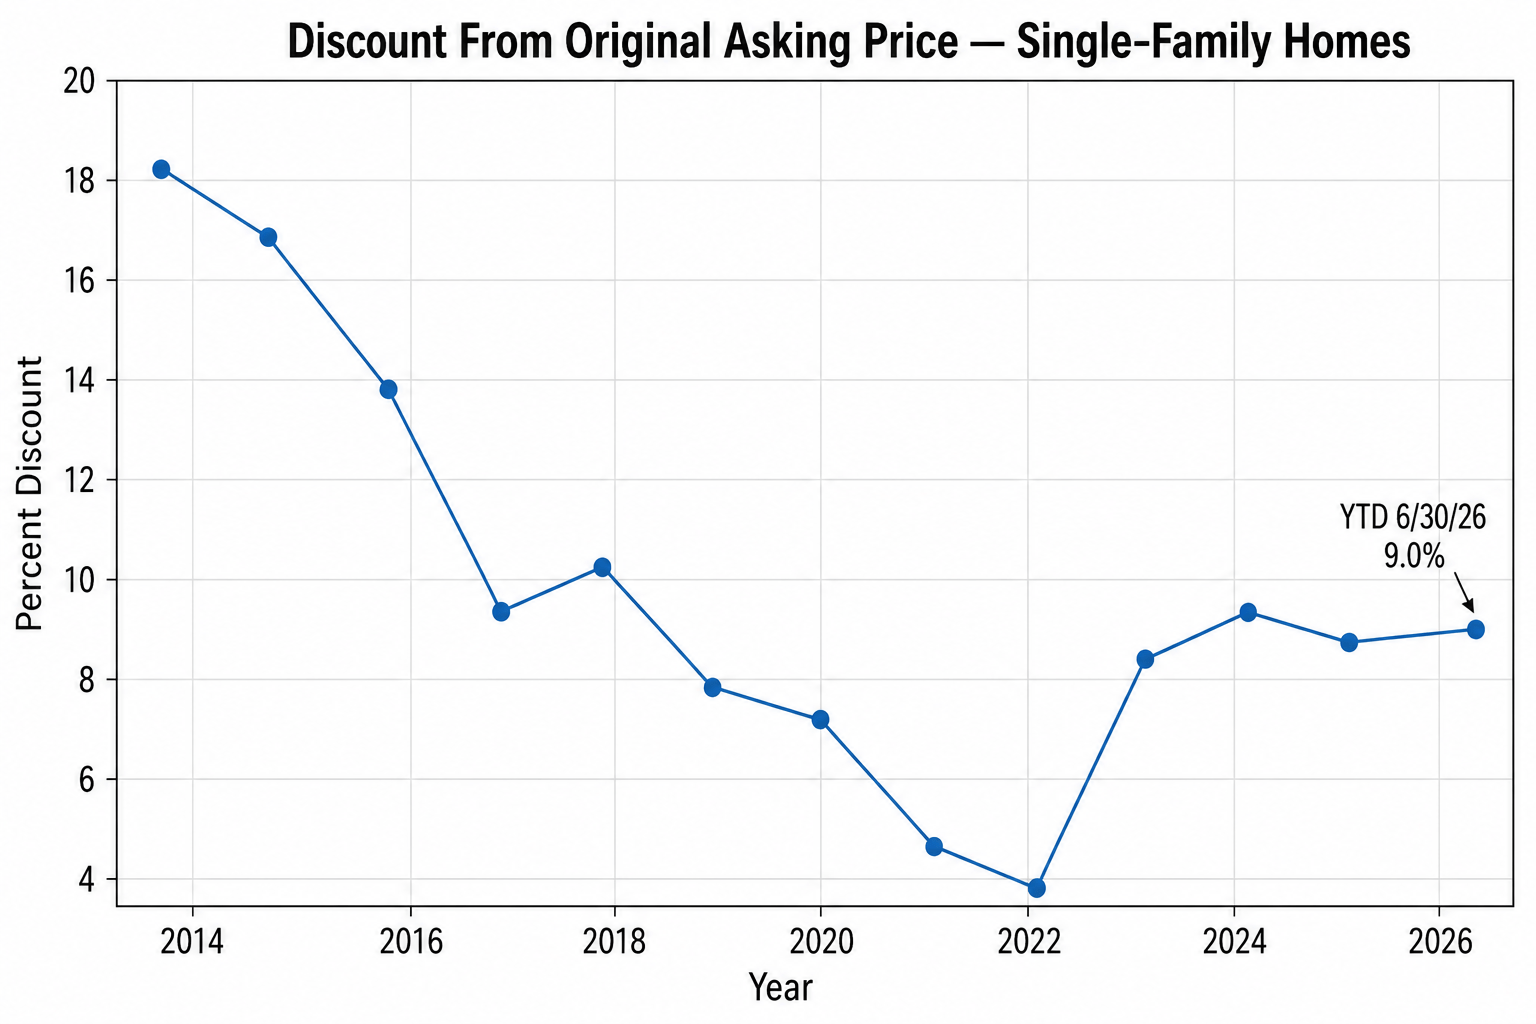
For the 139 sales closed in the first six months this year, final sales price averaged 5.0% less than the asking price when the home when under contract; however, it was 9.0% less than the initial asking price when the home was first listed. For the full year 2025, these discounts were 5.1% and 8.8% respectively. The chart below shows that the discounts were lowest in 2022 at the height of the boom, and have been trending higher since then. Homes that are priced as if the market is as strong as it was in 2020-2022 are taking longer to sell, and often go through one or more price reductions before they sell.
DAYS ON MARKET
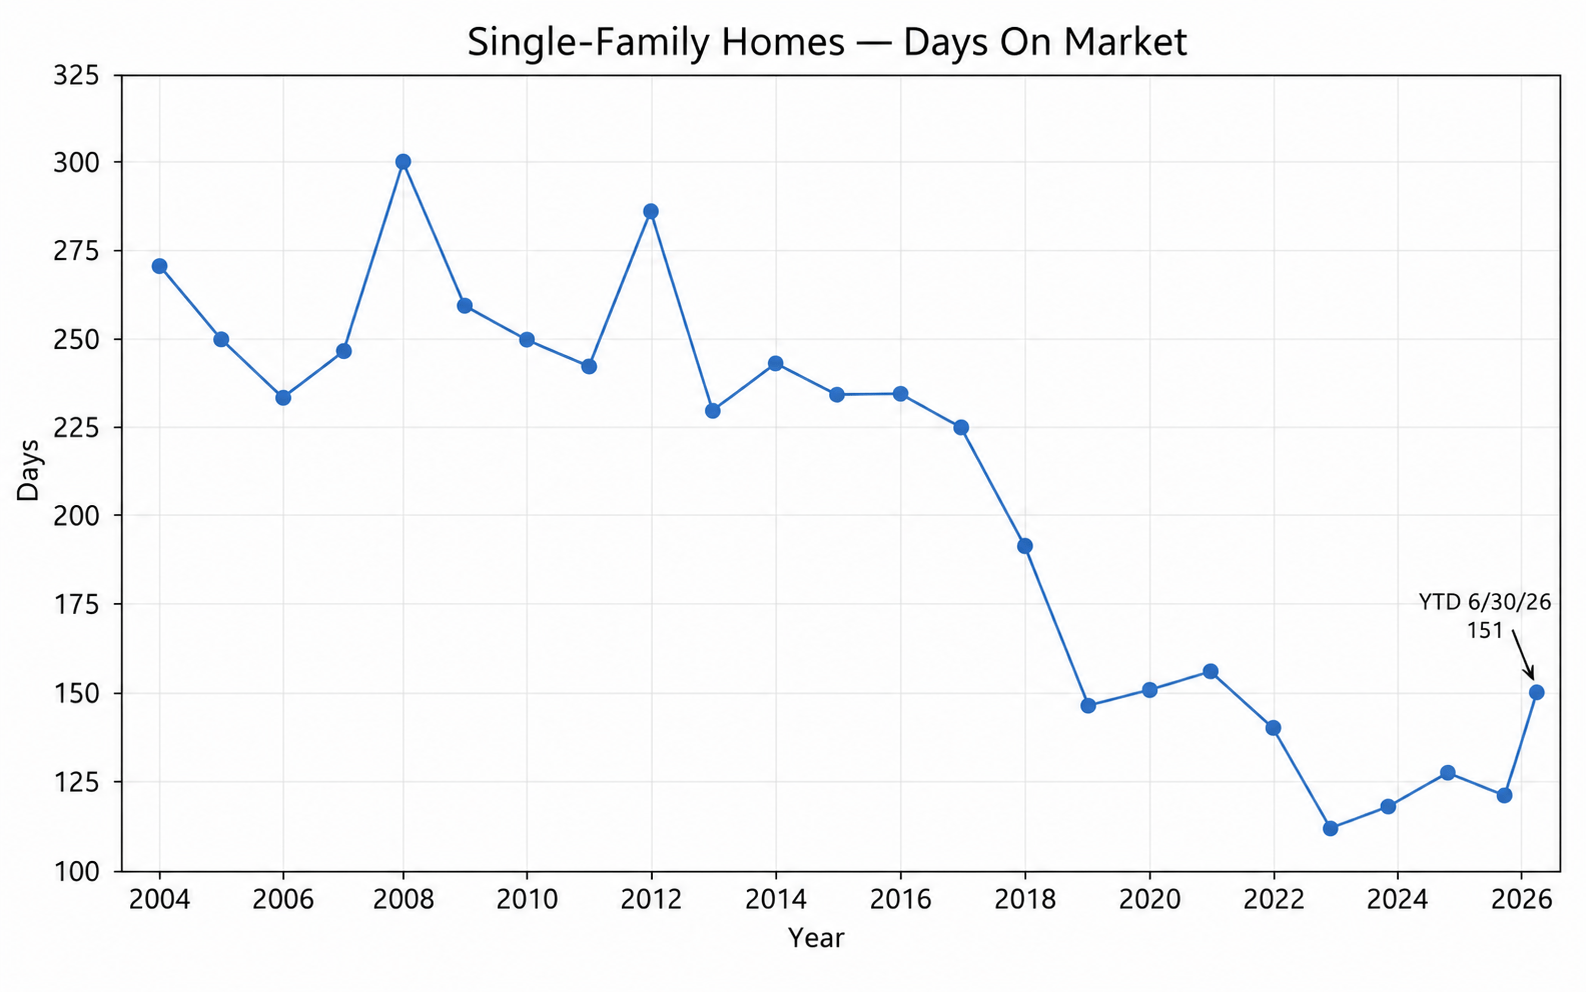
In 2026 through June, the average number of days from the start of a listing to when the house went under contract was 151, an increase of 31 days compared to the same time period in 2025. This is an indicator that the market is slowing. DOM started trending down in 2011 as demand began to outstrip supply. It reached a low point in 2022 during the market peak at 111. It has been trending higher since then. Note that in Taos, average time to sell has always been much higher than in many parts of the country—where homes typically sell in 30-45 days in normal times. For the years 2003 – 2016, in Taos it took an average of 250 days for a house to sell.
INVENTORY
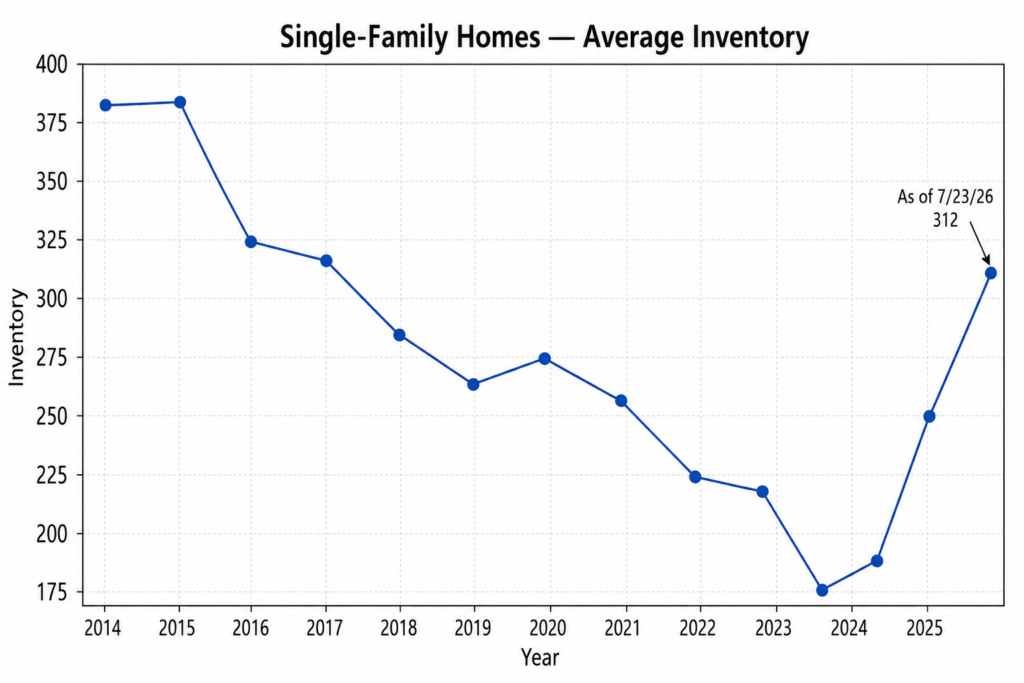
The supply of homes available for purchase has continued to increase from a low point in 2023 of 159 homes listed for sale. At the time this report was prepared, there were 312 homes listed, up 153 (96%) from the low, and up 52 houses (+20%) from 3 months ago. It appears that more homeowners are deciding that it is time to sell even if it means giving up their ultra-low mortgage loan interest rates. Also, sellers may be thinking that they had better sell now in case the market really weakens.
Supply and demand are more in balance than they were a few years ago. It has become somewhat easier to find more than just a few homes to show a buyer that meet most of his/her criteria. Nevertheless, Taos inventory consists of a wide variety of style, size, location, condition and price, so although buyers now have more choice then they did several years ago, inventory is still far below what was typical in the years before the 2009 real estate market collapse. For example, in September of 2008, there were 518 homes listed for sale, and you often could find 10 or more homes to show a buyer! The graph below shows how average inventory plummeted to a low point in 2023 just after the boom market peak, and has been increasing since then.
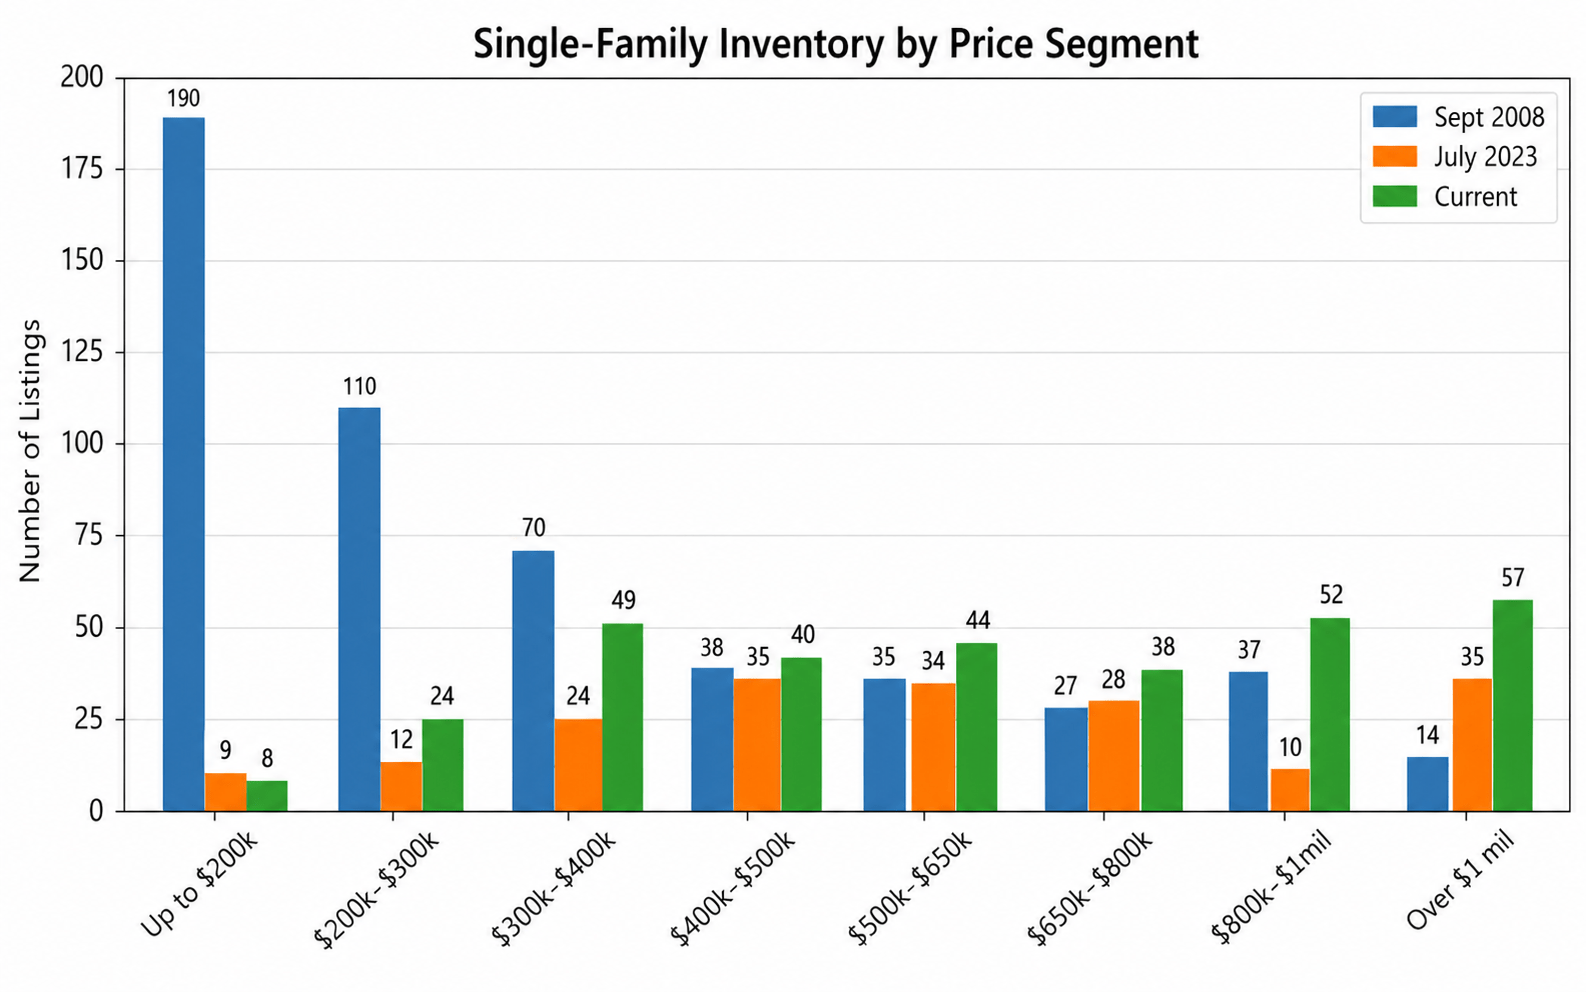
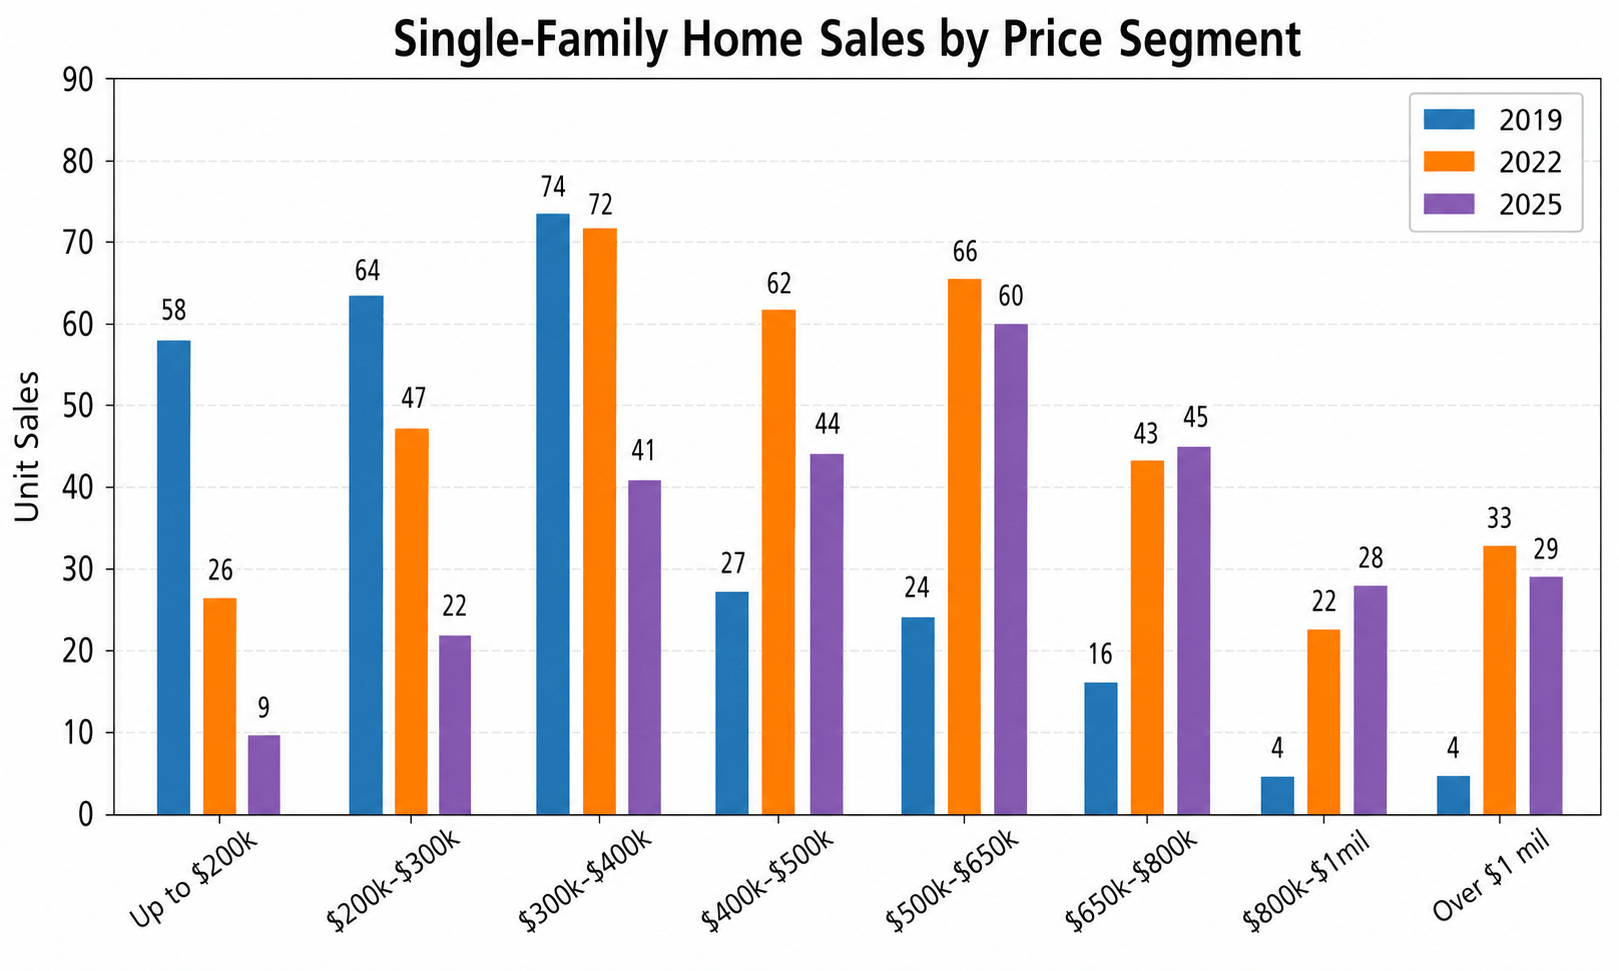
The two graphs below illustrate how the number of homes available for purchase in the lower price segments has dwindled, while sales of higher-priced homes have increased dramatically. This is a result of the rise in the overall price level as well as strong increases in consumer wealth (stock market and other asset price gains). A home that had a value of $350,000 pre-Covid is now worth probably $550,000 – $600,000. Many buyers are comfortable paying for more expensive homes.
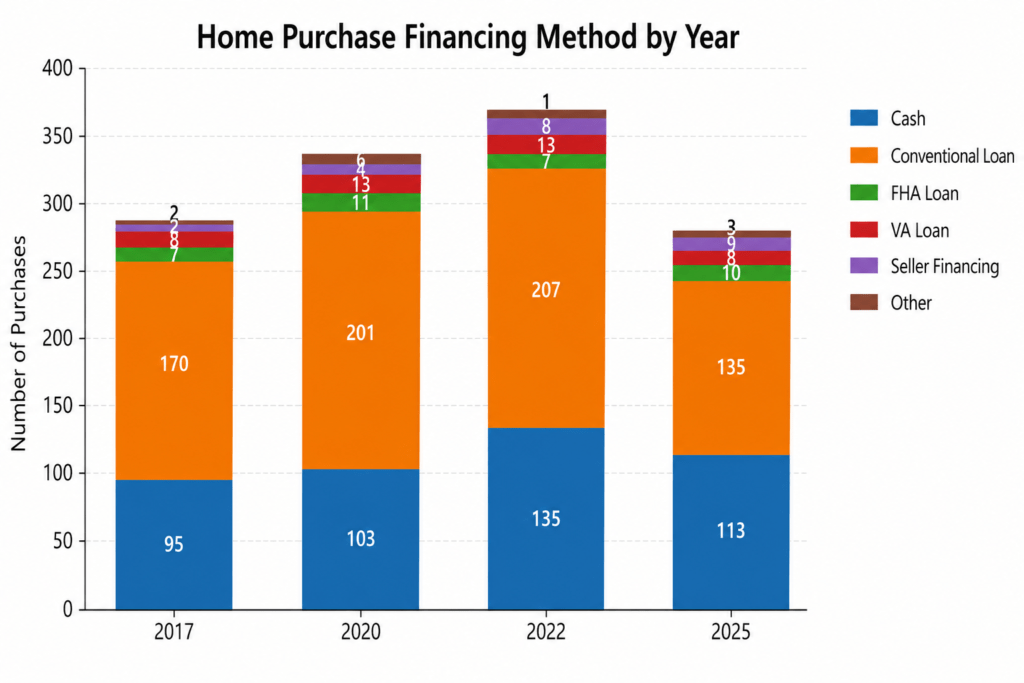
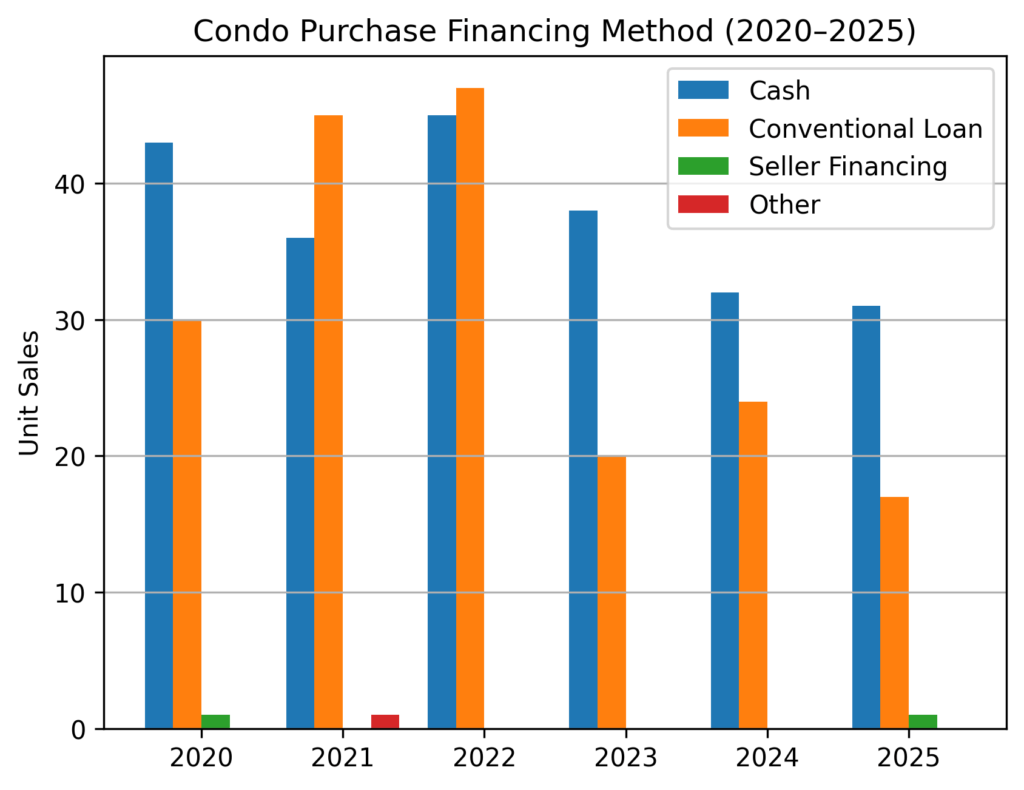
This chart shows that conventional loans have diminished as a percentage as interest rates have risen.
INTEREST RATES
The 30-year fixed rate loan was averaging 6.58% at the time of this report’s writing. That is up from 6.30% three months ago, but down from just over 6.74% in July 2025. The war in Iran has caused inflation to remain above the Federal Reserve’s target. The expectation of higher inflation along with concern about the government’s burgeoning debt will probably keep interest rates on long-term debt to remain at current levels–or to rise. Mortgage rates are generally linked to the rate on 10-year Treasury notes; therefore, mortgage rates will probably stay in a range of 6.5% – 7.0% for the rest of this year.
By now most people realize and accept that mortgage rates are not ever going back down to the super-low levels that occurred during 2009-2021. Those rates were created by the government’s “quantitative easing” program to prevent a possible depression after the Global Financial Crisis of 2008. The Covid pandemic risk to the economy was another reason to keep rates suppressed and to flood the financial system with excessive liquidity. Ultra-low interest rates caused asset prices (including real estate) to rise dramatically.
Some people may not remember that 6%-7% was a very normal mortgage rate for many years before 2008. Here is a link to the Federal Home Loan Mortgage Corporation (“Freddie Mac”) web site where you can see rates going back to 1971: https://www.freddiemac.com/pmms
| Conventional 30-year fixed | 6.58% |
| Conventional 15-year fixed | 5.96% |
Note: Individual borrower interest rates are impacted by credit score, down and type of occupancy.
FORECLOSURE SALES
In the first 6 months of 2026, there has been just one foreclosure sale. In each of the years 2023, 2024 and 2025, there were but 4 foreclosure sales; in 2022 there were none. The number of foreclosures diminished steadily from a peak of 55 in 2012 during the aftermath of the Global Financial Crisis. Currently, there are only two bank-owned houses listed for sale. Foreclosures are not expected to rise substantially even if the economy slumps; this is because lending standards were tightened after the GFC, and most borrowers can withstand a downturn without defaulting on their home loans.
Please Note: These data do not include any condominiums developed or offered for sale by Taos Ski Valley Resort; those condos are not listed in the Taos MLS.
Condo sales remain in a down trend.
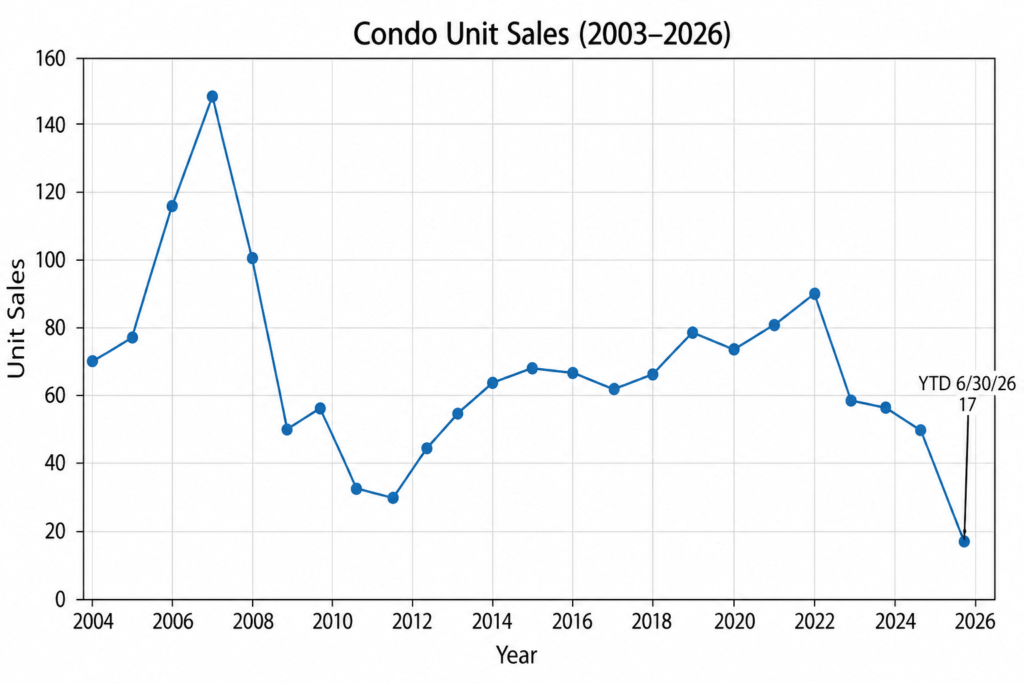
For the first 6 months of 2026, the number of closed sales was down by 7 units compared to the same time period in 2025, at 17 vs. 24 sales (-29.2%). Condo sales have been lackluster since 2022. Limited inventory is part of the reason; but there just doesn’t seem to be much interest among buyers for condos these days.
Dollar sales for the first quarter were down 38.8%. Both median and average prices were down slightly. Total dollar sales and average prices are affected by the “sales mix”—the relative number of higher- and lower-priced units sold. Of the 17 condos sold so far in 2026, only 2 (12%) were at Taos Ski Valley (where prices tend to be substantially higher than in town); in 2025 for the same time frame, 8 out of the 24 sales (33%) were at TSV.
The high-water mark for Condo sales was 2006, when 149 units sold. There was much more inventory for buyers to choose from back in the early 2000’s, and there was more buyer interest in condos. After 2006, sales dropped to a low of 29 in 2011 (in the downturn that followed the Global Financial Crisis); they then gained slowly up to a recent high of 92 in 2022. Since then, they have been drifting steadily downward.
MEDIAN AND AVERAGE PRICES
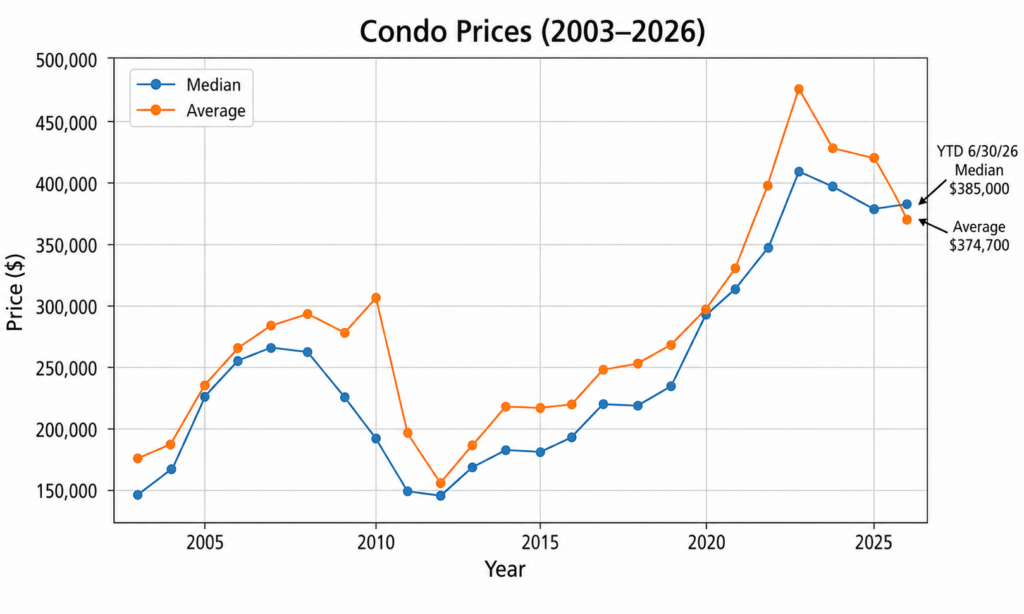
Median price for 2026 through Q2 is $385,000 vs. $400,000 in 2025, a drop of $15,000 (-3.8%). Average price is $374,700 vs. $433,500, a decrease of $58,800 (-13.6%). Full-year 2025 median was $380,000 vs. $397,300 in 2024, a decline of $17,300 (-4.4%); 2025 average price was $420,800 vs. $429,100 in 2024, a drop of $8,300 (-1.9%). As noted above, in a data set of only 17 sales so far this year, with significantly fewer sales at Taos Ski Valley, the are skewed; regardless, it seems fairly clear that the condo market is weak in terms of both unit sales and prices.
PRICE DISCOUNTING
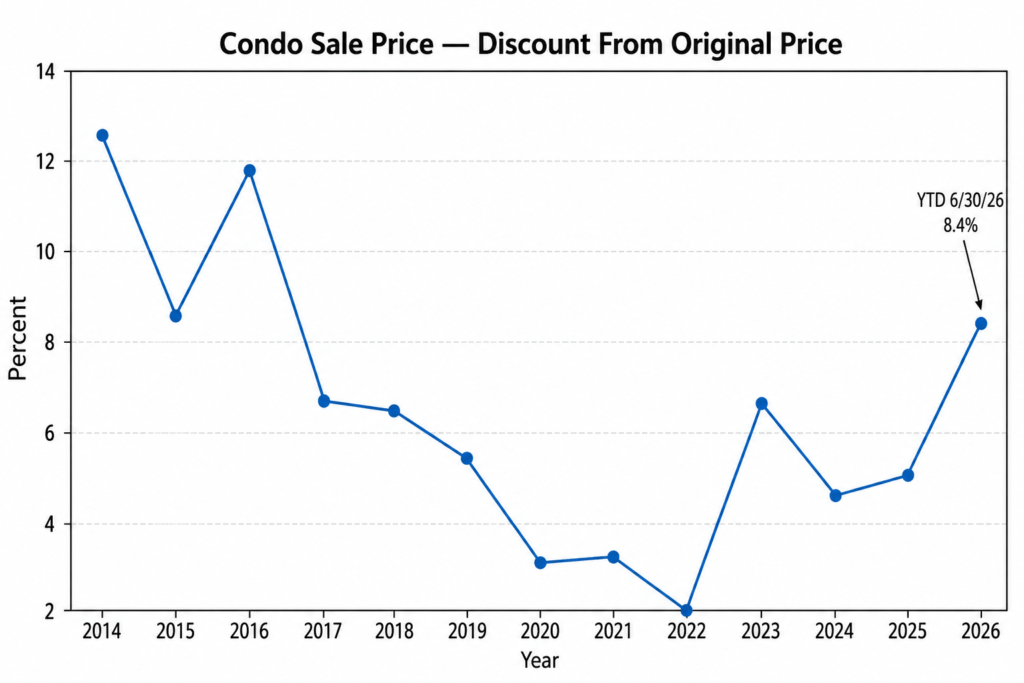
For the first half of 2026, sales prices averaged 3.6% less than the asking price when the condo went under contract. The discount from original price when the condo was first listed was 8.4%. For full year 2025, final sales price averaged 3.3% less than the asking price and 5.1% below original listing price. Full-year 2024 discounts were 3.0% and 4.7%, respectively. The uptick in price discounting corroborates that the condo market is soft.
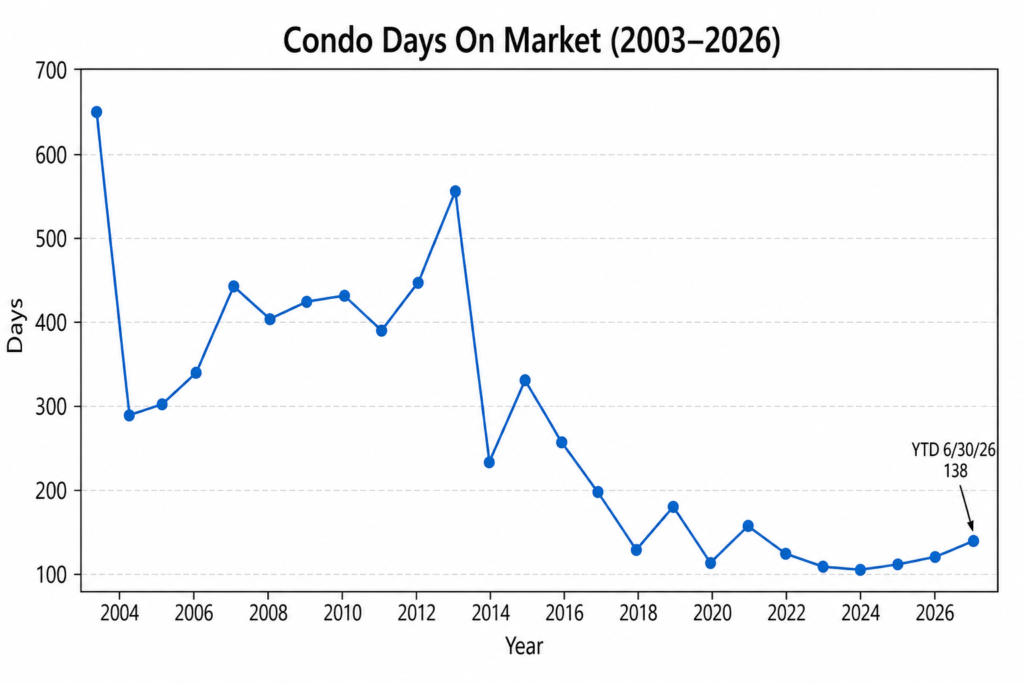
DAYS ON MARKET – Year-to-date June 30, DOM were 138 vs. 95 for the same time frame in 2025, a jump of 43 days (+45.3%)— Another indication that the condo market is weak.
INVENTORY
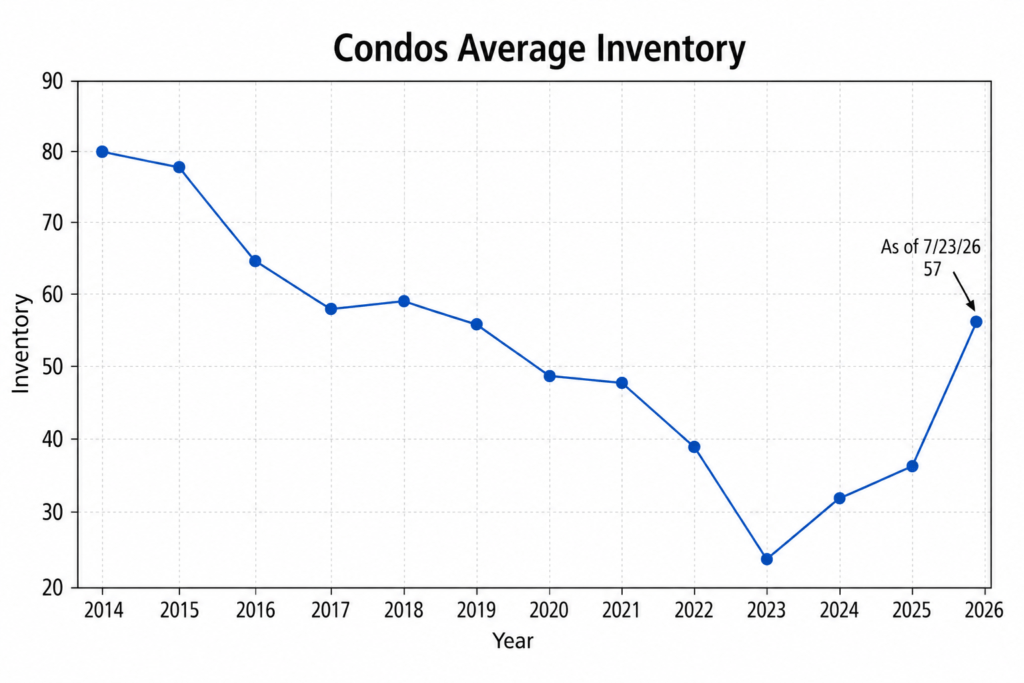
The number of condos listed for sale at the time of this report was 57, up 8 from three months ago. Of the 57 condos currently listed for sale, 13 (23%) are at Taos Ski Valley; 44 (77%) are in or near central Taos.
In 2005-2006, when condo development and sales were at their peak, there were often approximately 200 condos on the market at any given time, with the majority in or near central Taos. There were 149 condos sold in 2006. The table below shows a steady decrease in average inventory for each year from 2014 to 2023, and not much increase since then. There hasn’t been much developer interest in building new condos, probably due to high construction costs and tepid buyer demand for condo product.
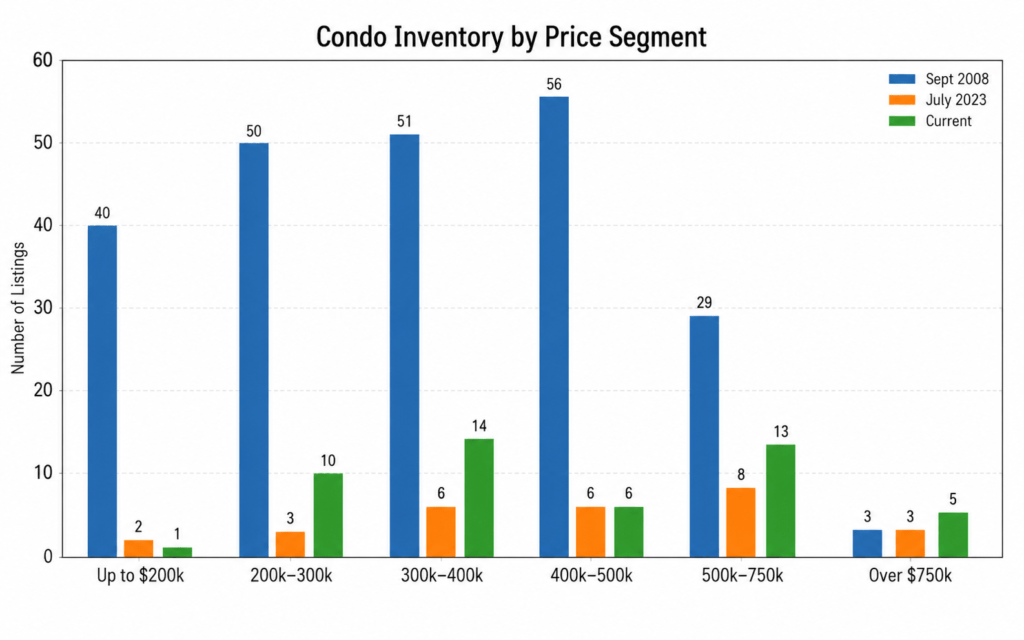
Here is Condo Inventory by Price Segment comparing Current with a Year Ago and with Sept 2008 when inventory peaked:
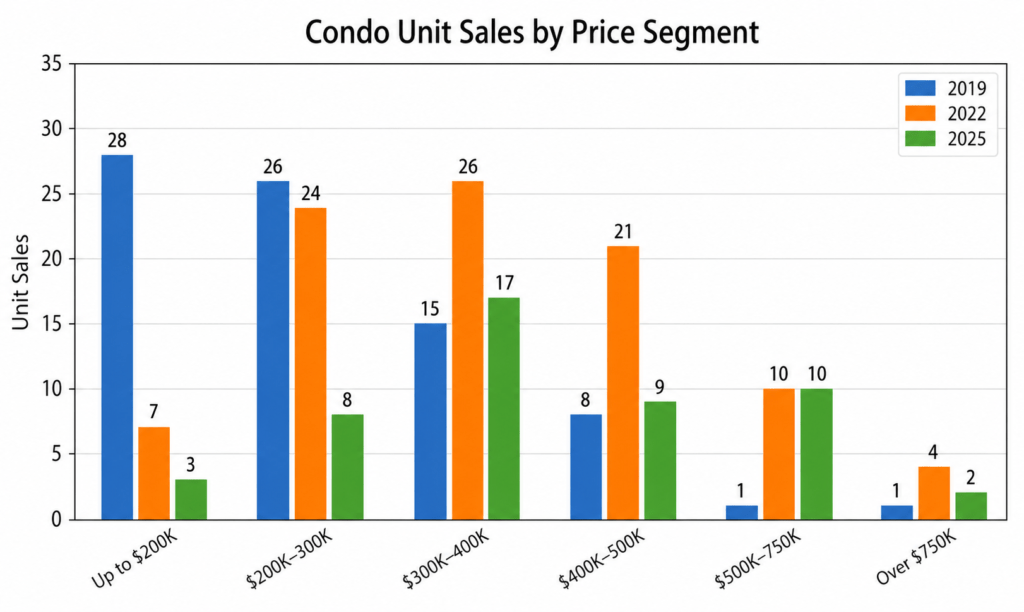
The following bar chart shows Condo unit sales by Price Segment:
This bar chart shows that loans were a higher proportion than cash during 2021 and 2022 when interest rates were ultra-low, and loans were easy to get:
FORECLOSURE SALES
There have been no foreclosure sales so far in 2026. There haven’t been any since 2019, when there was only one.
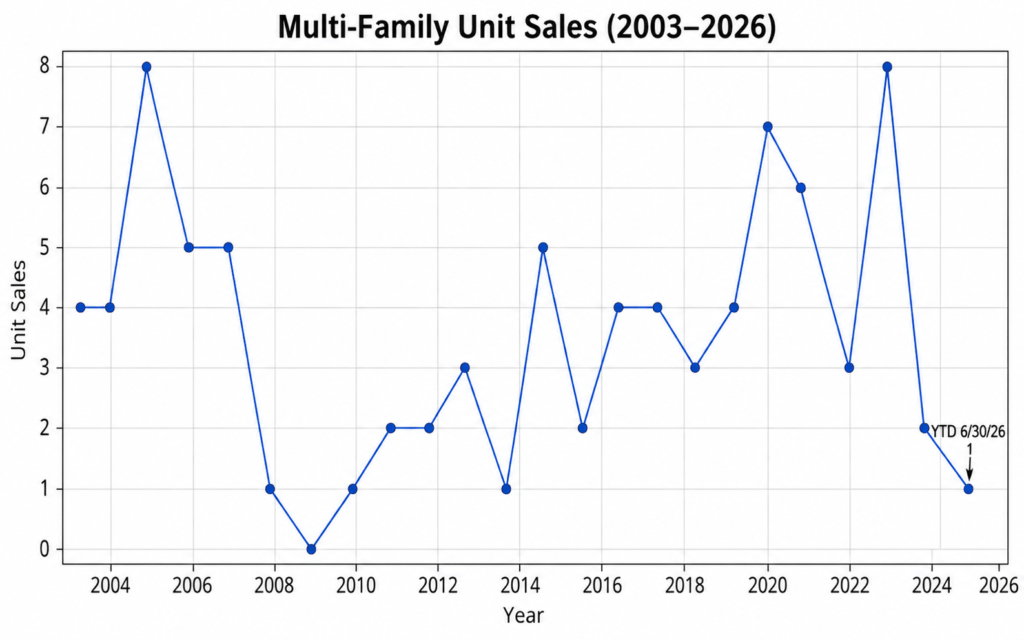
There has been only one sale of a Multi-family property so far in 2026.
The sale was for a duplex out on the west mesa. The sale price was $380,000. 2025 also had just one sale in the first half of the year, and the total for the year was just 2 sales. The graph below shows the number of sales by year from 2003 – 2025. The average per year is 3.8. Multi-family has always been a very small portion of the Taos real estate market. Higher interest rates are no doubt weighing on this segment, by negatively affecting investors’ ability to achieve a satisfactory rate of return.
In an economy of higher interest rates, investors normally require higher “capitalization rates” to evaluate real estate investments. Investors divide a property’s Net Operating Income by their desired cap rate (their required rate of return expressed as a percentage) to calculate the price they can pay to achieve the target rate of return. For example, if a property generates Net Operating Income of $25,000 per year, a cap rate of 5% means a value of $25,000/5% = $500,000; a cap rate of 8% gives a value of $312,500
There is huge need for affordable housing, and Multi-family would be a large part of that; but “making the numbers work” in Taos has always been a challenge. For new construction, the high cost of land in suitable locations combined with high costs for materials and labor, make it difficult to achieve a reasonable rate of return. Additionally, most multi-family properties listed for sale are small (typically 2- 4 units); therefore, management expenses further reduce Net Operating Income.
Multi-family will remain a small part of our martket, at least in the near future. Currently, there are 12 multi-family listings for sale; one has a pending sale.
Land sales continue to sag.
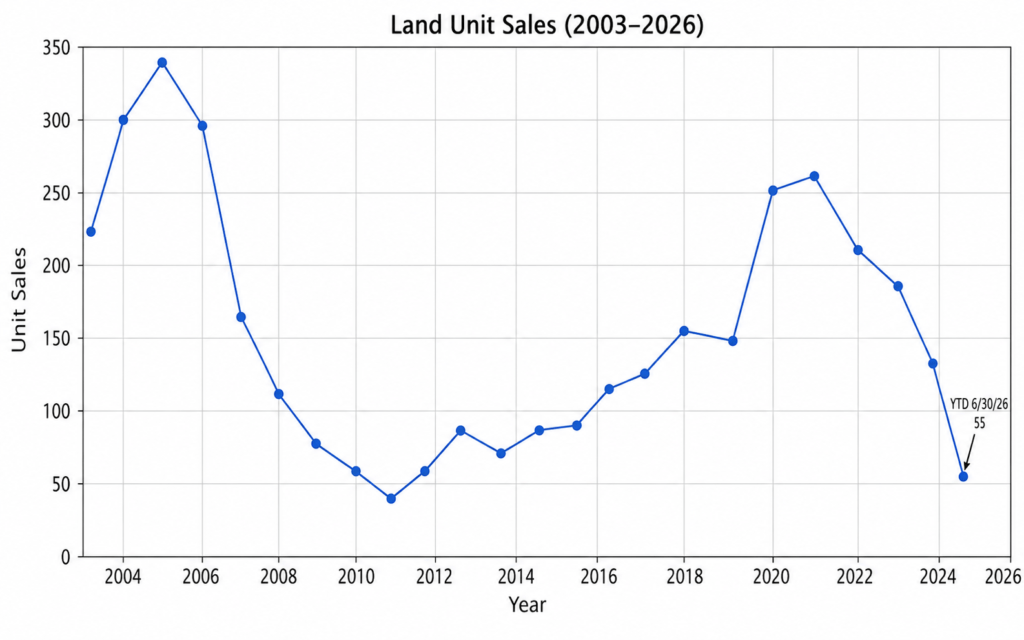
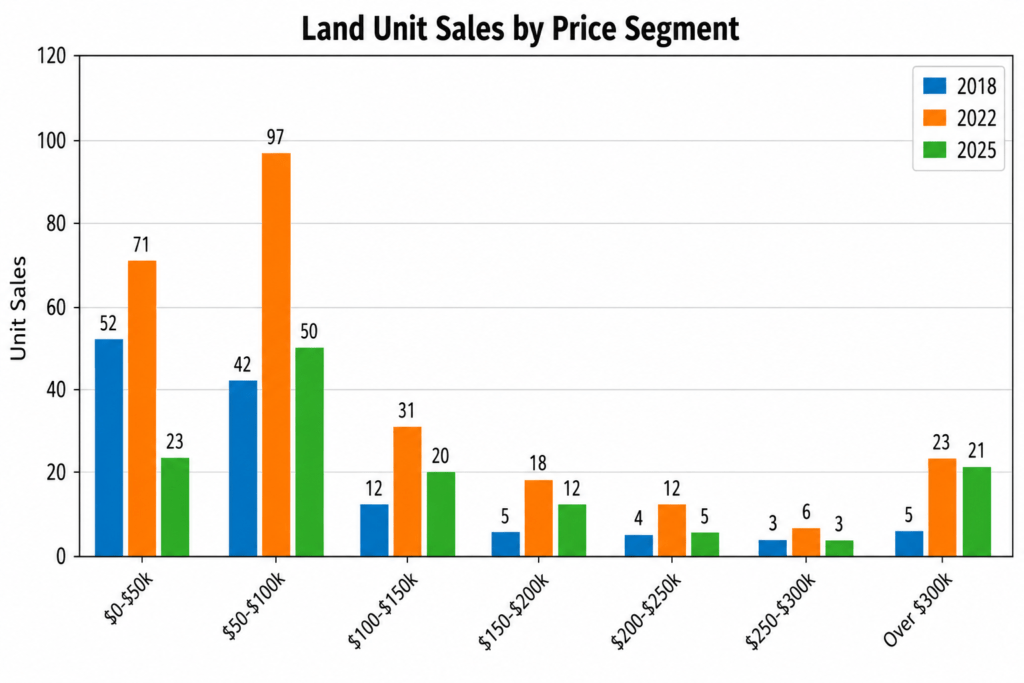
2026 first half number of sales was 55 vs. 70 in the first half of 2025, a drop of 15 sales (-21.4%). Dollar sales were down 61.8%, as both median and average prices fell. Since a brief rally in 2021-2022 during the Covid pandemic boom market, sales have diminished each year.
The primary constraints on land sales are 1) very high building costs and 2) the long lead time to start and complete construction of a home. There aren’t a lot of good custom home builders working in Taos, and they are booked up for about two years. For a good-quality home (but not a really high-end one) it costs more than $400 per square foot for the hard dollar cost of construction. This doesn’t include the land purchase, design, possible well drilling, septic system installation, and landscaping. The likelihood that costs will remain high will continue to be a drag on land sales. And with the supply of existing homes for sale increasing, buyers have even more reason to forego building a new home.
Back in peak year 2005, when there was a lot of interest in land and building costs were relatively reasonable, there were 339 closed sales with a total dollar value of $46 million. Whereas sales of single-family homes had got back to 2005’s level by 2021-2022, land sales are still well below the levels of 2004-2006.
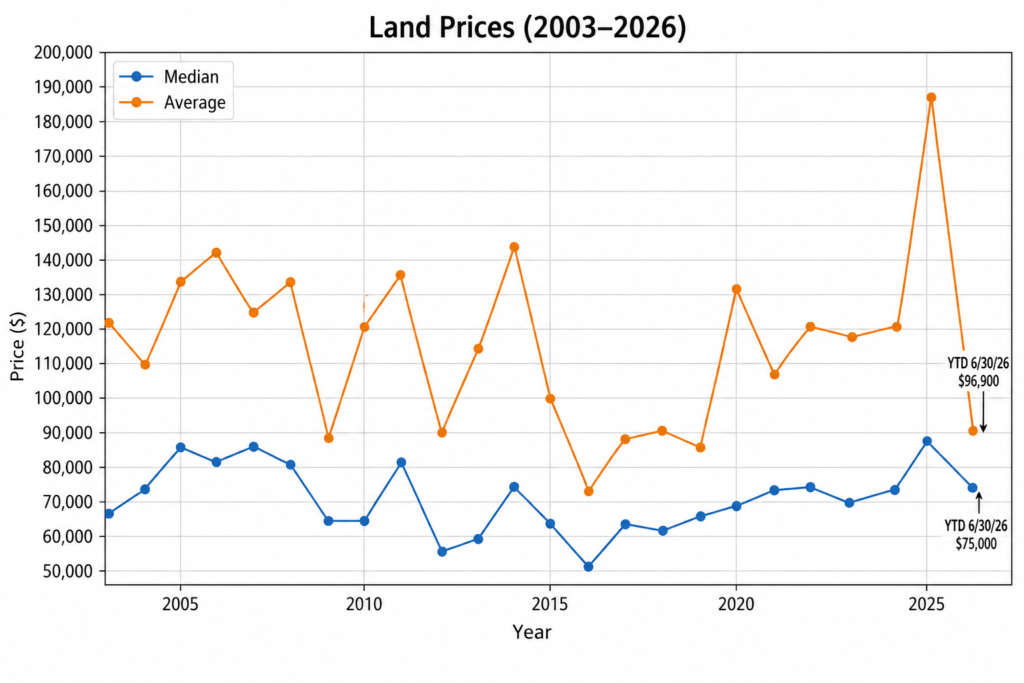
Price Level – Note: The median price—the price at which there is an equal number of sales above and below– is a better measure of the overall price level than average price. The average price (total dollar sales divided by the total number of sales) can be skewed by several extremely high-priced sales, and also by relatively more sales in the higher price brackets in one year compared to another year..
Median price for 2026 year-to-date June 30 was $75,000 vs. $94,000 for the same time period in 2025. That’s a decrease of $19,000 (-20.2%). There were more sales in the higher price brackets last year in the first half of the year. For full year 2025, the median was $92,300.
Average price so far this year is $95,000 compared to $196,900 last year for the same time frame, a decrease of $101,000 (-51.3%). Again, last year saw relatively more sales in the higher price brackets (above $250,000). This year 15 of the 55 sales (27%) were above $100,000; last year 32 of the 79 sales (41%) were above $100,000.
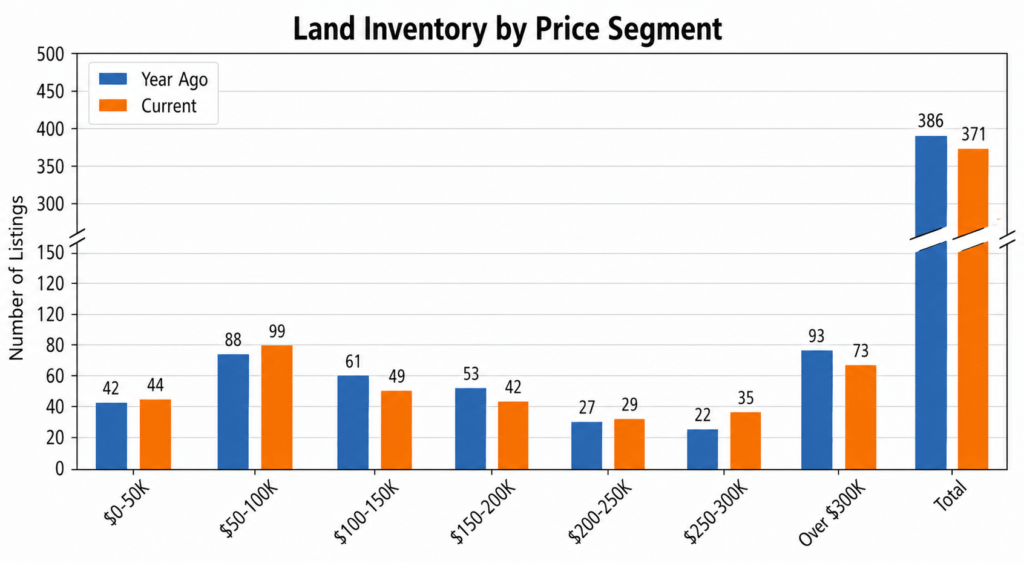
Current inventory of 371 tracts listed for sale is within the 350-450 range that has been typical for most of the past 20 years. At the current absorption rate, 371 tracts equals a 3.4-year supply, i.e., much more supply than demand.
INVENTORY AND UNIT SALES BY PRICE SEGMENT
PRICE DISCOUNTING
For the first 6 months of 2026, actual selling price averaged 8.2% below the last asking price when the property went under contract; the discount from original price when the land was first listed was 15.2%. For full year 2025, these discounts were 11.5% and 15.6%, respectively. The land market is a buyer’s market: with much more supply than demand, buyers are able to negotiate sizable discounts. Overpricing a listing is definitely a poor strategy in this market.
DAYS ON MARKET
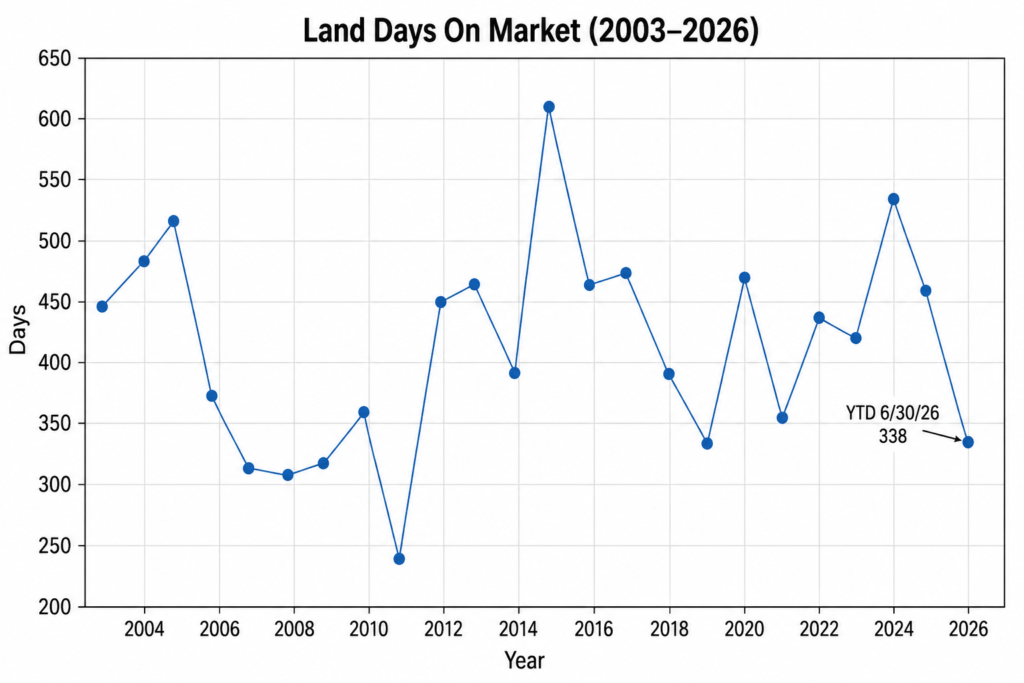
The average days on the market for 2026 year-to-date is 338, a decrease of 74 days (-18.0%) from 2025 for the same time frame; this is also well below the full-year 2025 average of 456, and the 2024 average of 534. As the chart below illustrates, DOM for land has varied from a low of 332 to a high of 605 over the past 12 years; the average is 443.
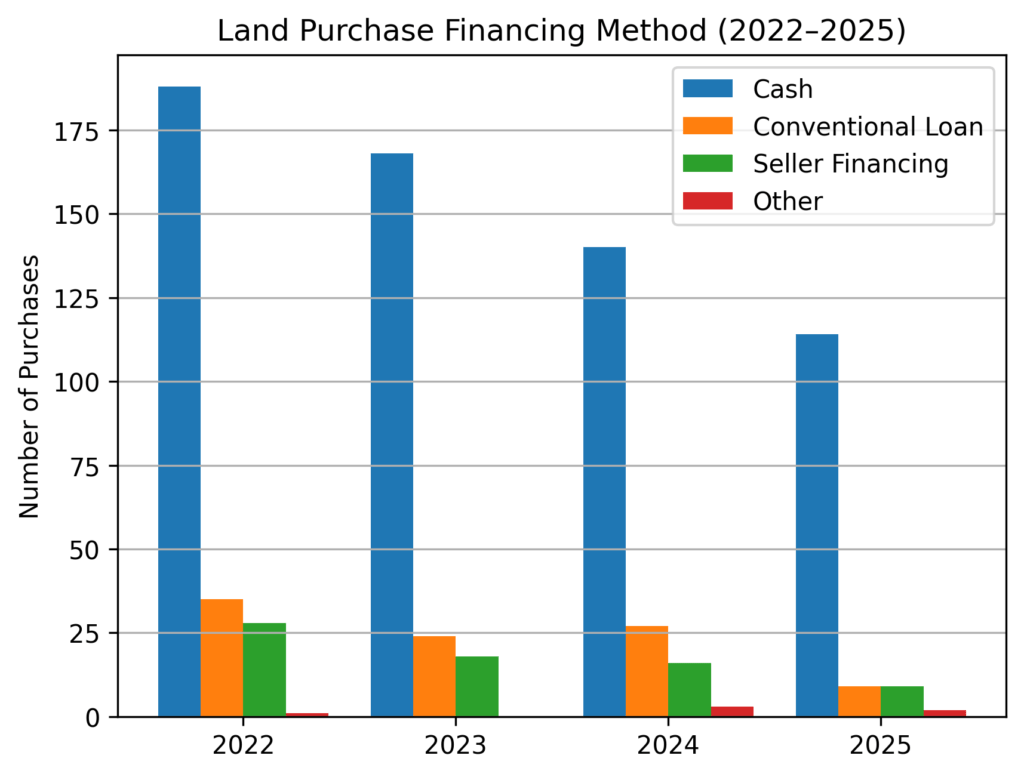
How Land Purchases Were Financed
Cash has always been the primary way that Land purchases are financed. Back in the early 2000’s up to the Global Financial Crisis of 2008, land financing through banks was more common; in fact, land loans were available through some home mortgage brokers. After the GFC, lending standards tightened a lot, and land financing became more difficult—and more expensive—to obtain. These days, land loans are usually handled by commercial banks in the local area. Such loans typically require a down payment of 30%-35%, and are made for a term of only 5-7 years.
The Commercial market is very slow.
For the first half of 2026, there have been just 2 sales, compared to 1 sale in 2025 for the same time period. For the full year 2025, there were only 5 closed commercial transactions, a decline of 3 sales from 2024. After a boomlet in 2022—when there were 18 closed sales— the commercial market has come down to a more typical level for Taos (i.e., small). The chart below shows that 6-8 commercial transactions per year has been the norm. The 2022 boomlet was driven by demand for locations for cannabis retailers as soon as the State of New Mexico legalized recreational marijuana sales.
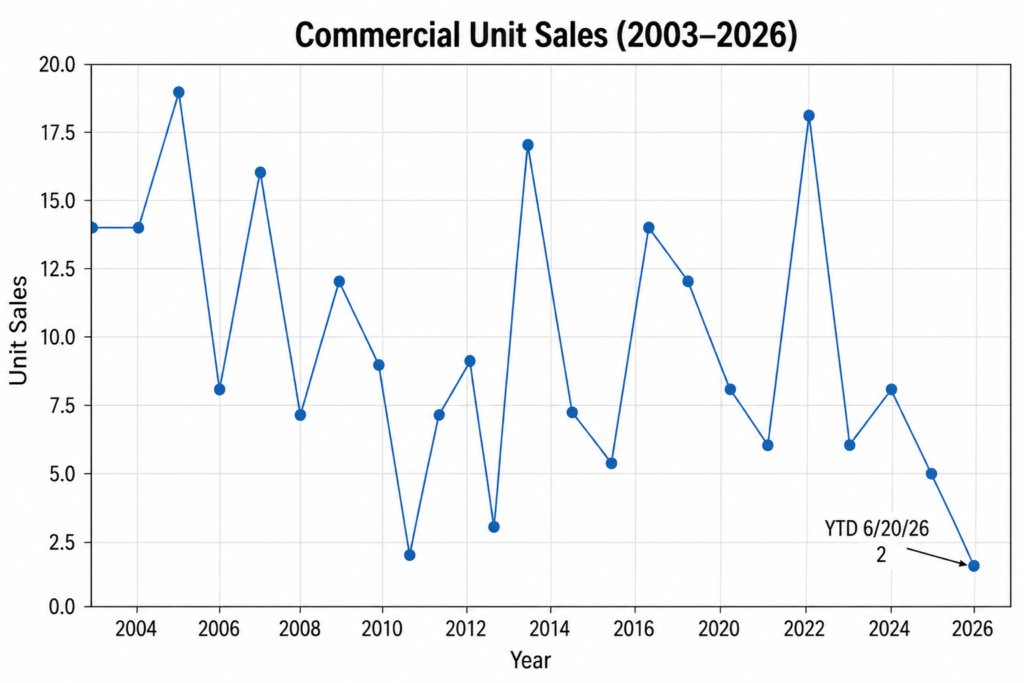
2026 sales will probably be about the same as 2025’s. The commercial market is negatively affected by the higher interest rates that have prevailed for the past two years. As with multi-family property, higher interest rates affect potential return on investment: If financing is involved higher rates on the debt reduce cash flow; and they may also affect the buyer’s ability to qualify for a loan. Cash buyers will also be affected by higher interest rates because they will adjust the required rate of return on investment upward; higher cap rates will reduce a commercial property’s valuation, often to well below what the asking price is.
Additionally, misgivings about the health of the economy, and an ongoing shortage of labor, have made commercial investments less attractive. However, there is some commercial development happening, including a second Cid’s food store, an expansion of the Town’s only car dealership, and another self-storage facility, to name a few. Recently the Taos Pueblo announced a 120-room hotel and recreation project on land the tribe owns near Taos center.